Chrome DevTools MCP ·
Chrome DevTools MCP: give your coding agent real CSS and Lighthouse failures
The Chrome DevTools MCP server lets a coding agent read the CSS on an element and failing Lighthouse audits with their DOM nodes. What changed in 1.10 and 1.11.
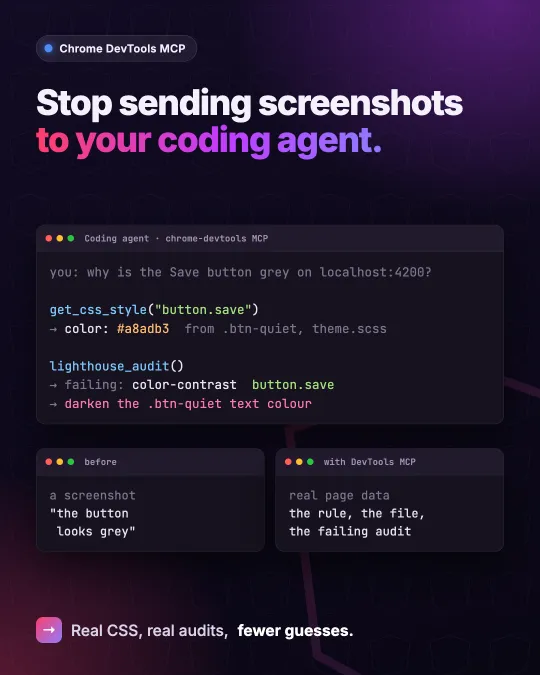
When a layout breaks, the quick move is a screenshot pasted into a coding agent. The agent then has to guess which CSS rule made the button grey. The Chrome DevTools MCP server gives it the real page instead: it starts a Chrome instance the agent can drive and inspect through MCP tools.
What's new in 1.10 and 1.11
Version 1.10.0 (23 September) added a get_css_style tool for the styles applied to an element. Version 1.11.0 (15 October) changed lighthouse_audit to return the failing audits together with the DOM nodes behind them, added emulation for more CSS media features, and added support for debugging WebMCP tools.
Setup
The README shows one entry for your MCP client configuration:
{
  "mcpServers": {
    "chrome-devtools": {
      "command": "npx",
      "args": ["-y", "chrome-devtools-mcp@latest"]
    }
  }
}
Then point the agent at your dev server, for example localhost:4200 for an Angular app, and ask it why something looks wrong.
Where it helps
It pays off on the bugs that screenshots describe badly: a style coming from an unexpected selector, a contrast failure, a layout that only breaks under a certain media feature. You still review the fix yourself, but the agent starts from the same evidence you would open in DevTools.
Sources
I post short notes like this on LinkedIn.